Explore Naogaon’s Agricultural Scenario And Statistics
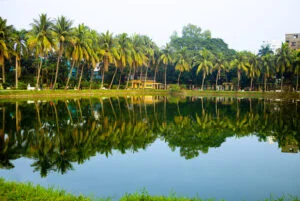
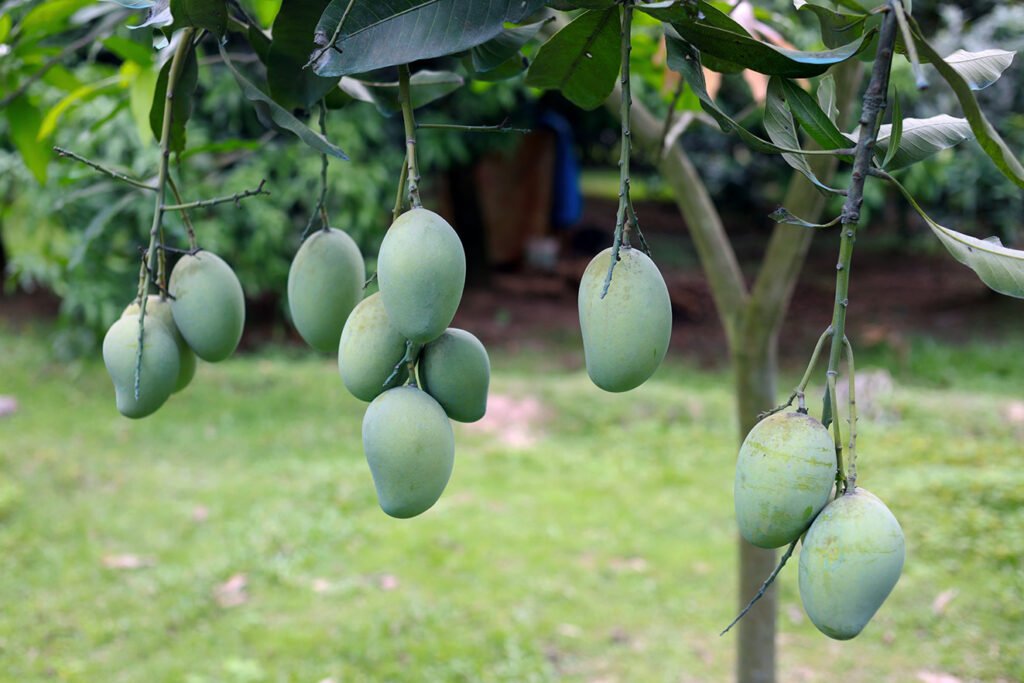
Naogaon is a northern district of Bangladesh which is renowned for its rich agriculture. Agriculture is the backbone of its economy. This district belongs to the Barind region and the Barind Multipurpose Development Authority (BMDA) is responsible for its agricultural development. The farmers here produce a diverse range of agri products, and the agricultural output of this district significantly contributes to the country’s agriculture sector. Naogaon is known as “Bread Basket” for huge amounts of rice production. And recently, Naogaon district earned the title ‘Mango Capital of Bangladesh‘ for producing the highest volume of mangoes among all districts in the country.
According to the Year Book of Agricultural Statistics of Bangladesh 2022, the district has 6,11,822 holdings. Of these, 63.83% have farming facilities where they grow different kinds of crops.1
Achievement and Challenges of Agriculture in Naogaon
Naogaon district’s agriculture has gotten better recently because of new technologies and better watering systems. They also use improved seeds and fertilizers now. Due to the unremitting efforts of the farmers and some help from the government, agriculture in Naogaon district has grown faster than ever before. There are challenges such as climate change, infrastructure gaps, and limited technology access. If it overcome these challenges, Naogaon’s agriculture could be as good as in developed countries. Meanwhile, farmers in Naogaon and across Bangladesh are diligently utilizing their capabilities to reach this goal.
Land Usage in Naogaon
The table below provides a detailed breakdown of land use in Naogaon district, showing the different land classes in hectares and their respective areas. It highlights the cultivable land and the total area under single, double, and triple crops. Additionally, it details the area of cultivable fallow land and irrigated land, reflecting the region’s agricultural scenario.2
| Land Usage | Area (Hectares) |
|---|---|
| Total Land | 350,651 |
| Cultivable Land | 273,832 |
| Single-Crop Land | 44,486 |
| Double-Crop Land | 163,893 |
| Triple-Crop Land | 61,205 |
| Cultivable Fallow Land | 2,833 |
| Land Under Irrigation | 212,456 |
Main Agricultural Food Products in Naogaon
Iri (ইরি) paddy, Boro (বোরো) paddy, Ropa (রোপা) paddy, Aman (আমন) paddy, Sugar-cane (আখ), Maize (ভুট্টা), Potato, Mustard, Wheat, Mango, Banana etc.3
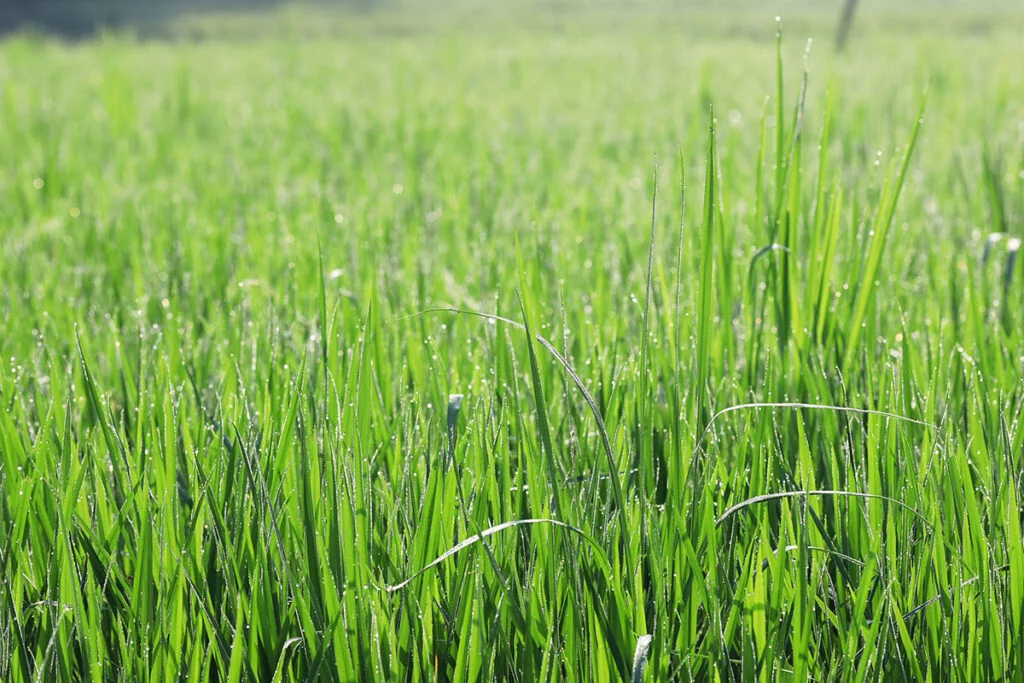

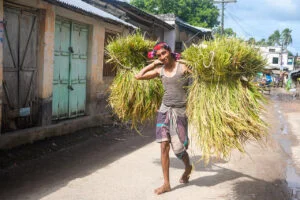
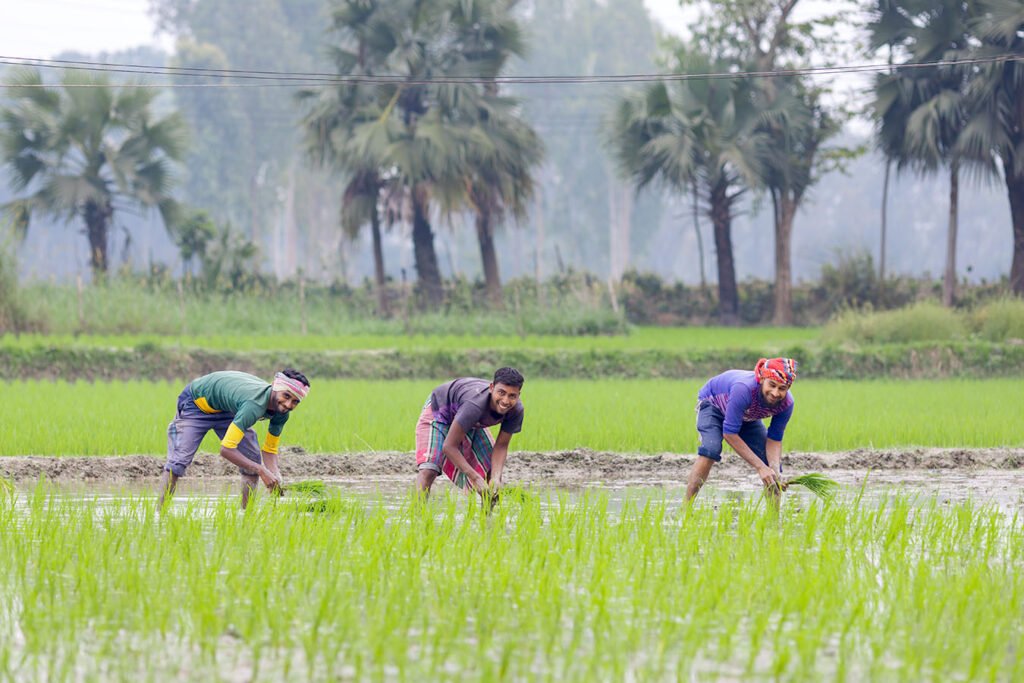
Paddy: The Dominant Agricultural Crop in Naogaon
Paddy is the primary and a heroic crop grown in Naogaon region. Nowadays, farmers grow both new high-yielding types and the traditional old varieties. While a variety of other crops are also cultivated, the region’s highly fertile land allows farmers to grow multiple cycles of crops in a single year. This includes a mix of paddy and other crops, sometimes as many as four cycles annually. Additionally, the district is known for producing jute, wheat, maize, and various types of vegetables.
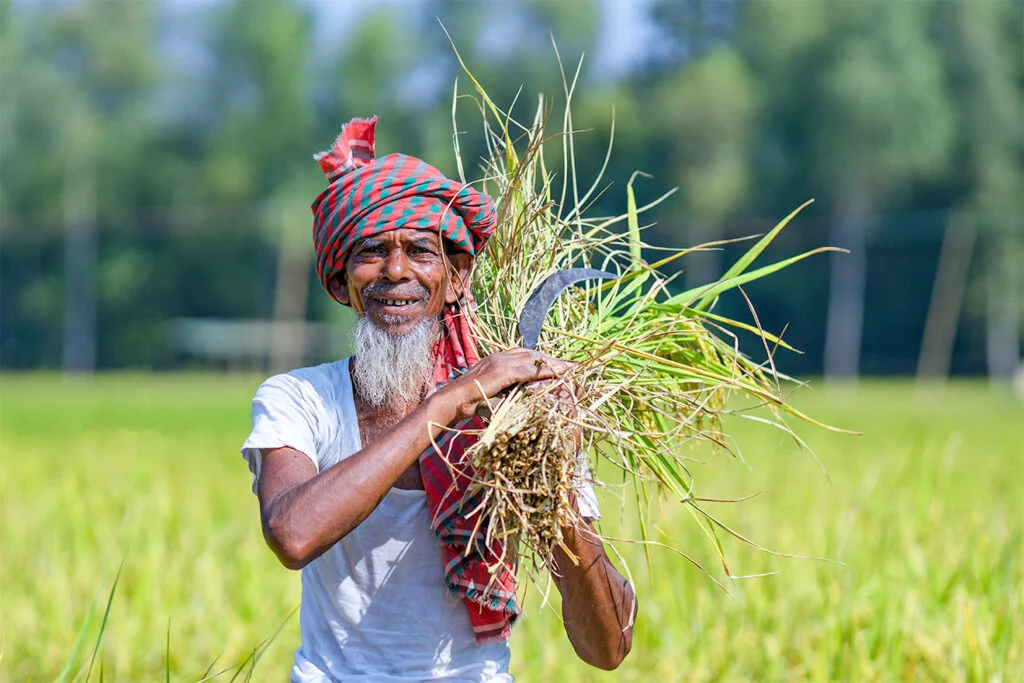
Rice: The Gem of Agriculture in Naogaon
Aman Rice Production in Naogaon
2019-20 fiscal year
- Cultivated area: 415,743 acres
- Production: 482,854 metric tons
2020-21 fiscal year
- Cultivated area: 468,054 acres
- Production: 506,606 metric tons
Boro Rice Production in Naogaon
2019-20 fiscal year
- Cultivated area: 455,511 acres
- Production: 807,132 metric tons
2020-21 fiscal year
- Cultivated area: 458,122 acres
- Production: 818,693 metric tons
Rice Production Boro + Aman
2019-20 fiscal year
Total Production: 1,289,986 metric tons
2020-21 fiscal year
Total Production: 1,325,299 metric tons
Rice Crop Production in FY 2009-10 and 2010-11
Here is a list detailing the types of rice crops, their cultivation areas, and the corresponding productions in the Naogaon district. Covering two fiscal years, 2009-2010 and 2010-2011, it offers a comprehensive view of the agricultural output during this period. A comparison of the two years shows that the total rice production in the fiscal year 2009-2010 was higher than that in the fiscal year 2010-2011.4
Fiscal Year 2009-2010
| Type of Rice Crop | Cultivated Area (acres) | Total Production (MT) |
|---|---|---|
| Aus | 107,293 | 118,080 |
| Aman | 467,581 | 818,074 |
| Boro | 459,810 | 1,046,546 |
| Total | 1,034,684 | 1,982,700 |
Fiscal Year 2010-2011
| Type of Rice Crop | Cultivated Area (acres) | Total Production (MT) |
|---|---|---|
| Aus | 134,542 | 129,489.19 |
| Aman | 486,124 | 472,113.79 |
| Boro | 481,999 | 786,991 |
| Total | 1,102,665 | 1,388,593.98 |
Overview
When it comes to agriculture in Naogaon district, paddy comes first. According to the Yearbook of Agricultural Statistics-2021, Naogaon’s rice production saw an increase between the fiscal years 2019-20 and 2020-21. Specifically, production rose from 1,289,986 metric tons to 1,325,299 metric tons. This growth was largely due to a significant expansion in Aman Rice cultivation. An additional 52,311 acres were cultivated, leading to an increase of 23,752 metric tons. Conversely, Boro Rice saw a modest acreage increase of 2,611 but yielded an extra 11,561 metric tons. This indicates improved yield for Boro rice in 2020-21.
Gram Production
Overview
According to the Statistics Yearbook of Agriculture Statistics-2021, Naogaon district has experienced a consistent decline in the production of grams/chickpeas (Chhola – ছোলা) over the last three fiscal years. Production was 85 metric tons in fiscal year 2018-19 that decreased to 77 metric tons in FY 2019-20, and further dropped to 71.17 metric tons in FY 2020-21. This decline may be due to farmers shifting their focus to more profitable crops.
Naogaon Agriculture: Maize (Bhutta) Production
Fiscal year 2019-20
- Cultivated area: 17,799 acres
- Production: 64,762 metric tons
Fiscal year 2020-21
- Cultivated area: 17,238.18 acres
- Production: 61,452.66 metric tons
In Naogaon district, maize (bhutta – ভুট্টা) farming area under cultivation decreased from 17,799 acres in the fiscal year 2019-20 to 17,238.18 acres in the fiscal year 2019-20. And the maize production at that period decreased from 64,762 MT to 61,452.66 MT.
Naogaon Agriculture: Garlic Production Chart (2018-2021)
According to the Yearbook of Agricultural Statistics-2021, the chart shows the production of both garlic and onion in Naogaon district.7
The chart showcases the trend in garlic production in Naogaon district over a span of three fiscal years. From the fiscal year 2018-19, there was a production of 7,276 MT, which saw a slight increase to 7,319 MT in 2019-20. The subsequent year, 2020-21, witnessed a more significant rise reaching a production volume of 7,434 MT. The data underscores the consistent growth in garlic production in the district. All quantities are measured in metric tons (MT).
Onion Production Chart (2018-2021)
The chart showcases the onion production trends in Naogaon district over three consecutive fiscal years. From the fiscal year 2018-19 to 2020-21, there has been a steady increase in production. Starting with 24,947 MT in 2018-19, it rose to 25,331 MT in 2019-20, and further increased to 26,473.94 MT in 2020-21. This progress indicates the growing contribution of the district’s onion cultivation. All quantities are represented in metric tons (MT).
FAQs on Agriculture in Naogaon District
How many agricultural holdings are there in the district as of Bangladesh 2022?
As of 2022, the district has a total of 6,11,822 agricultural holdings.
Which is the primary crop cultivated in Naogaon?
Paddy stands out as the dominant crop in Naogaon, with a blend of modern high-yielding varieties and traditional ones being cultivated.
How much rice does Naogaon district produce?
In the fiscal years 2019-20 and 2020-21, Naogaon’s rice production figures were 1,289,986 metric tons and 1,325,299 metric tons, respectively.
What about onion production in Naogaon?
Onion production has steadily increased in the district from 24,947 MT in 2018-19 to 26,473.94 MT in 2020-21.
Which authority oversees Naogaon’s agricultural advancements?
The Barind Multipurpose Development Authority (BMDA) plays a pivotal role in steering the agricultural development of Naogaon.
References and Footnotes
- Year Book of Agricultural Statistics of Bangladesh 2022 ↩︎
- BBS – Naogaon – At a Glance ↩︎
- Naogaon District Statistics Office – At a glance ↩︎
- District Statistics 2011, Naogaon ↩︎
- Year Book of Agricultural Statistics of Bangladesh 2022 ↩︎
- Yearbook of Agricultural Statistics-2023 ↩︎
- Year Book of Agricultural Statistics of Bangladesh 2022 ↩︎
- Year Book of Agricultural Statistics of Bangladesh 2022 ↩︎