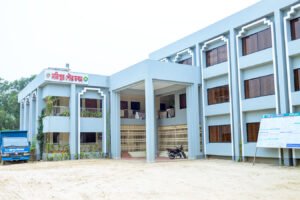
Nazipur Pourashava (Bangla: নজিপুর পৌরসভা), a category “C” municipality, serves the residents of Nazipur town under Patnitala Upazila of Naogaon district. The municipality was first started its journey in 1999.
Nazipur Pourashava at a glance
- Established: 07 October, 1999
- Category: ‘C’
- Area of Municipality: 11.81 sq. km.
- Roads: 27.990 km., paved = 9.5 km., rough = 18.5 km
- Wards: 9
- Mosques: 20
- Temples 09
- Number of NGOs: 10
- Government Primary School: 04
- Private Primary School: 03
- Kinder Garden School: 09
- Secondary School: 04
- Madrasa-03
- College: 03
- Fire Service Unit: 1
- Telephone number: 07428-63060 (Office)
- Website: https://nazipurpourashava.gov.bd
Population
| Ward No. | Total Population |
|---|
| Ward No. 01 | 1,570 |
| Ward No. 02 | 2,169 |
| Ward No. 03 | 6,494 |
| Ward No. 04 | 2,962 |
| Ward No. 05 | 2,340 |
| Ward No. 06 | 4,161 |
| Ward No. 07 | 4,062 |
| Ward No. 08 | 1,931 |
| Ward No. 09 | 2,141 |
| Pourashava Total | 27,830 |
Ward-wise Literacy Rate
| Ward No. | Total Literacy Rate (%) | Male Literacy Rate (%) | Female Literacy Rate (%) |
|---|
| Ward No. 01 | 74.14 | 77.39 | 70.90 |
| Ward No. 02 | 82.88 | 86.28 | 79.64 |
| Ward No. 03 | 94.41 | 95.58 | 93.30 |
| Ward No. 04 | 81.85 | 84.15 | 79.58 |
| Ward No. 05 | 80.05 | 81.67 | 78.46 |
| Ward No. 06 | 91.36 | 92.77 | 89.99 |
| Ward No. 07 | 90.37 | 92.29 | 88.47 |
| Ward No. 08 | 90.59 | 93.53 | 87.74 |
| Ward No. 09 | 87.74 | 90.04 | 85.69 |
| Pourashava Total | 87.98 | 89.93 | 86.09 |
As of the 2022 census,1 Ward No. 03 of Nazipur Pourashava holds the highest literacy rate of 94.41%. On other hand, Ward No. 01 has the lowest literacy rate of 74.14%. In total, Nazipur Pourashava has a total literacy rate of 87.98%, where male population holds 89.93% and female 86.09%.
Population by Religion in Nazipur Pourashava
| Ward No. | Muslim | Hindu | Christian | Buddhist | Others |
|---|
| Ward No. 01 | 887 | 682 | 1 | 0 | 0 |
| Ward No. 02 | 1,241 | 928 | 0 | 0 | 0 |
| Ward No. 03 | 5,905 | 576 | 2 | 1 | 10 |
| Ward No. 04 | 2,088 | 871 | 3 | 0 | 0 |
| Ward No. 05 | 1,252 | 1,079 | 6 | 0 | 0 |
| Ward No. 06 | 3,781 | 370 | 9 | 0 | 0 |
| Ward No. 07 | 3,813 | 239 | 10 | 0 | 0 |
| Ward No. 08 | 765 | 1,057 | 109 | 0 | 0 |
| Ward No. 09 | 1,118 | 989 | 34 | 0 | 0 |
| Pourashava Total | 20,850 | 6,791 | 174 | 1 | 10 |
Number of Households and Average Household Size
| Ward No. | Total Households | Average Household Size |
|---|
| Ward No. 01 | 449 | 3.50 |
| Ward No. 02 | 582 | 3.69 |
| Ward No. 03 | 1,609 | 3.67 |
| Ward No. 04 | 881 | 3.36 |
| Ward No. 05 | 628 | 3.66 |
| Ward No. 06 | 1,210 | 3.37 |
| Ward No. 07 | 1,127 | 3.40 |
| Ward No. 08 | 502 | 3.66 |
| Ward No. 09 | 579 | 3.59 |
| Pourashava Total | 7,567 | 3.53 |
As per the 2022 census the average household size in the Pourashava is 3.53 across 7,567 households. The largest household size is found in Ward No. 02, which is an average 3.69 persons. Ward No. 04 has the smallest average household size of 3.36 persons.
Divorced Population in Nazipur Pourashava
| Ward No. | Total Divorced Population | Male | Female |
|---|
| Ward No. 01 | 1,391 | 692 | 699 |
| Ward No. 02 | 1,863 | 900 | 963 |
| Ward No. 03 | 5,506 | 2,654 | 2,852 |
| Ward No. 04 | 2,526 | 1,256 | 1,270 |
| Ward No. 05 | 2,007 | 995 | 1,012 |
| Ward No. 06 | 3,485 | 1,701 | 1,784 |
| Ward No. 07 | 3,397 | 1,693 | 1,704 |
| Ward No. 08 | 1,649 | 807 | 842 |
| Ward No. 09 | 1,803 | 849 | 954 |
| Pourashava Total | 23,627 | 11,547 | 12,080 |
As of the 2022 census (see footnote), data from Nazipur Pourashava shows that Ward No. 03 has the highest number of divorced people at 5,506, while Ward No. 01 has the lowest at 1,391. The total divorced population across the municipality is 23,627, where 11,547 males and 12,080 females. This indicates that it has a higher number of divorced females than males.
Ward-wise Electrification & Source of Electricity
| Ward No. | Total Electrification (%) | National Grid Source (%) | Solar Power Source (%) | Other Source (%) | No Electricity (%) |
|---|
| Ward No. 01 | 100.00 | 100.00 | 0.00 | 0.00 | 0.00 |
| Ward No. 02 | 100.00 | 100.00 | 0.00 | 0.00 | 0.00 |
| Ward No. 03 | 99.94 | 99.87 | 0.00 | 0.06 | 0.06 |
| Ward No. 04 | 99.42 | 99.31 | 0.00 | 0.12 | 0.58 |
| Ward No. 05 | 99.35 | 99.18 | 0.16 | 0.00 | 0.65 |
| Ward No. 06 | 99.92 | 99.92 | 0.00 | 0.00 | 0.08 |
| Ward No. 07 | 99.63 | 99.54 | 0.09 | 0.00 | 0.37 |
| Ward No. 08 | 98.79 | 98.79 | 0.00 | 0.00 | 1.21 |
| Ward No. 09 | 97.91 | 97.39 | 0.35 | 0.17 | 2.09 |
| Pourashava Total | 99.56 | 99.46 | 0.05 | 0.04 | 0.44 |
Nazipur Pourashava shows an electrification rate of 99.56% (as of the 2022 census – see footnote). The electricity source with nearly all households relying on the National Grid (99.46%). The use of solar power and other sources is very limited. Ward No. 09 has the highest percentage of households without electricity, at 2.09%. Wards 01 and 02 have full electrification. These two wards show complete reliance on the National Grid.
References and Footnotes

